A Comparison of Hugo Nomination Distribution Statistics - Part 2
Tuesday, January 23, 2024 - 21:08

ETA: See also Part 1, link to the combined Camestos Felapton/Heather Rose Jones analysis.
ETA 2024/01/25: I've added cross-links between the related posts and will continue to update as needed. I'm not used to people actually coming to read my blog! If you like the numbers geekery, consider checking out the rest of my website. I've written some books! I run the Lesbian Historic Motif Project blog and podcast! I natter on about all manner of writing and fannish things!
Introduction
Accessibility Note: I acknowledge that by using images of the graphs and of some tables, the full analysis is not accessible to the visually impaired. For this I apologize, however my time and the abilities of my website are limited.
This is a further exploration of population-level patterns in Hugo Award nomination data. While the first installment was primarily aimed at asking the question, “is there something hinky going on in this data and if so, what?” this second installment is stepping back and asking, “are there different typical nomination patterns for different categories, and are the anomalies in 2023 general or focused on specific categories?”
The spreadsheet with the data will be available on Google Drive. Feel free to play with it for yourself, but be warned that I haven’t bothered to add much explanatory apparatus in the file as it wasn’t designed for public consumption.
My analysis here is not aimed at examining nominees, although in some cases the outliers are perfectly understandable and rational once you look up what the specific item/person was. Instead, I’m interested in patterns of behavior independent of the specific content.
One variable that I can’t really control for is any differences in nomination behavior due to the combination of two different literary populations, either in the specific (i.e., different population behavior due to a specific literary culture) or in general (i.e., the interactions of combined nominations from two distinct literary cultures). To the best of my knowledge, even when Worldcons have been held in non-Anglophone countries previously, there has not been a significant presence of non-Anglophone works in the nomination pool. (On an individual basis, one can see some “favorite son” effects among the people categories, but I think these are negligible on the level I’m examining.) When I selected the comparison dates, I wasn’t specifically aiming to include or exclude non-Anglophone Worldcons. By chance I did include Helsinki (2017) because it was the first EPH year, which adds a mild confounding factor, but my perception is any unusual behavior in 2017 is more attributable to post-Puppy reactions.
Methodology
To repeat the methodology as described in the previous installment:
Using the nomination statistics provided by each Worldcon, I tabulated the total number of nomination ballots cast for each category and the number of ballots that included each of the top 16 nomination-recipients. (Note: There were not always 16 items listed. Some years reported more than 16 items, but I truncated at 16 for a consistent comparison.) I ignored the question of "disqualifiations" or withdrawals -- the numbers represent what is reported as the raw nomination numbers.
From this, I calculated the percentage of the possible nominations that each of those 16 items received. That is, the number of ballots that listed an item, divided by the total ballots for that category, reported as a percent. This data is displayed as groups of columns, clustered by category. Because the data is reported as a %, the distribution is more easily comparable between categories with different numbers of total nominations.
Scope
I selected the following years to analyze:
- 2011 - the earliest year I happen to have data for
- 2012 - the last year before any Sad Puppy activity
- 2015 - the year of the most intense Sad Puppy activity with known nomination slates
- 2017 - the first year of E Pluribus Hugo
- 2021 - a recent year
- 2022 - a recent year
- 2023 - the current year
I considered adding more years into the mix, but the project was getting a little unmanageable, and sometimes larger amounts of very similar data detract from understanding rather than adding to it.
This time I’m looking at all award categories. Of those, Series, Fancast, and Lodestar have less data due to being added at various points during the scope of my data.
In addition to examining the percentage of ballots that works appeared on, I also consider the percentage of available ballot slots in each category that can be accounted for by the long-list nominees, as presented. I may also be making reference on occasion to the total nomination ballots in a category. I would have liked to compare the total number of different works nominated in each category however, as that data was not available for 2023, this was not a priority.
Review of Patterns: 2022 vs 2023
To begin with, let’s review the most obvious distribution differences between 2023 and a comparable year, for which I’ve picked 2022. I’ll put the two graphs next to each other for easy comparison.
The 2022 data demonstrates across the board the sort of pattern we expect from a population-based popularity poll. We have a consistent and continuous falling off from the most-picked nominees to less-picked ones. It isn’t uncommon for there to be one or sometimes more runaway favorites that make the initial part of the curve fairly steep. For example, in 2022 we can see this particularly in Drama-Long, in Fanzine, and in Fan Writer. In general, however, the bulk of the long-list nominees have a highly similar percentage distribution with respect to ballots having any nominees in that category. (Not shown in this graph is the significant variation in the number of ballots with data in each category, with the most popular category having 6x the participation of the least popular category.


In contrast, the 2023 distribution patterns are more variable. Some resemble the “standard” pattern (e.g., Short Story, Editor-Short, Astounding) although the overall percentages uniformly run higher. Some show an extreme “cliff” phenomenon (e.g., Novel, Series, Fanzine) where a group of nominees appear on a high proportion of the ballots, with a substantial gap in distribution between them and the less popular nominees. We still see the phenomenon where there may be a runaway favorite (e.g., Novelette, Drama-Long) but there are fewer of these than in the 2022 data.
It’s a bit hard to make out the details when all 19 categories are on display so let’s move on to look at the data from another angle.
Patterns Evaluated by Category
I’m going to group the nomination categories by my evaluation of whether they fall in the following:
- “Typical” distribution with nothing particularly interesting going on
- “Typical” distribution but with something else interesting
- Extreme “cliff” distribution
- Non-typical distribution of other types
Typical distribution – not much interesting
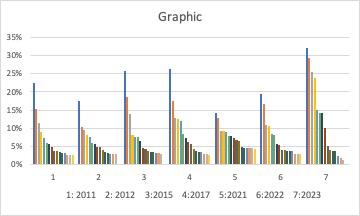
Historically, the distribution for graphic story has been highly consistent in terms of percentages. There is a slight tendency for years with larger overall numbers in this category to also have higher percentages – that is, when more people nominate, they have a slight tendency to cluster on the most popular works. 2023 shows a skew toward the more popular works being on a higher proportion of ballots than usual, but the long tail also falls off more steeply. 2023 did not have the largest number of ballots in this category. 2023 did have the highest proportion of available slots used (37%), but this is simply another way of stating that the percentage of appearances is shifted higher.

As we see, this category often has a standout favorite, but otherwise the distribution is relatively consistent from year to year. 2023 is slightly skewed towards the top picks, with the tail being lower than typical, but there isn’t any obvious discontinuity in the distribution. The combination of higher favorites, but lower percentage appearances for the tail means that the percentage of nomination slots used in 2023 is in the middle of the historic range at 26%. The total number of nominating ballots in 2023 is also in the middle of the historic range.
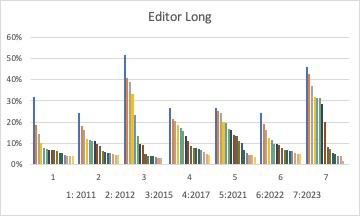
Editor (long form) is an interesting category, not so much for 2023, but for changes across the scope of the study. In 2015 (peak Puppy) there’s a definite skewing towards the more popular picks and a slight flattening of the end of the tail, but in the years after there’s also an increase in the proportion of nomination slots filled. People seem to be more engaged with the category and familiar with more candidates. In 2023, there’s a strong shift upward for the most-mentioned candidates, resulting in 61% of the nomination slots being filled. But the distribution is still relatively smooth and continuous.
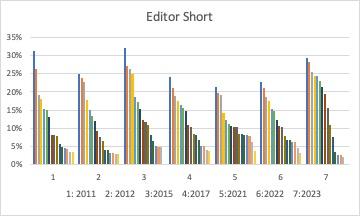
The story for Editor (short form) is very similar to long-form editor, even to the slight shift upwards in 2023. The proportion of available slots filled in 2023 is highest of all the years, but not by much (48%).
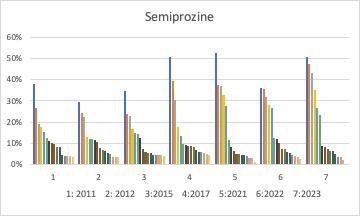
Semiprozine is interesting because there’s a shift in the basic pattern that is continued in 2023. Across the years studied, the concentration of interest in a group of “top picks” increases, resulting in a sort of “two mode” distribution curve – an initial higher cluster (that still trails off) then a less steep tail at the lower end. In isolation, the 2023 distribution might almost look like it’s edging toward a “cliff” distribution, except that 2017, 2021, and 2022 all have a similar pattern. I would suggest that this is a function of a relatively small number of semiprozines being exceedingly well known, in comparison to the general population. The percentage of slots filled in 2023 is, again, higher than other years (56%) but only slightly.
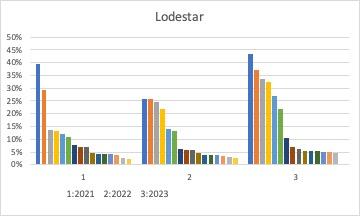
The Lodestar only began being given in 2018 so it only shows up in the three most recent years of my data. This makes comparison more tricky, but I’d say that (once more) the 2023 distribution is similar in shape to previous years, but with a shift upward in the percentage of ballots the most popular titles appeared on. One might speculate about what these consistent higher rates mean. (For example, is it the case that the people who are nominating are more “dedicated” that usual and therefore more likely to fill in more items?) Insufficient data to do more than guess.
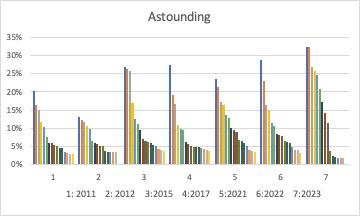
The Astounding nominations generally have low percentages (which makes sense, because when you’re nominating brand new authors, you tend to be dealing with a more broadly distributed familiarity among nominators). The fall-off for 2023 is a bit more convex than in other years, but there isn’t a discontinuity in the distribution.
Typical distribution – but something interesting
So let’s move on to the next group: categories where the distribution is relatively typical (no gaps or cliffs) but there’s something more interesting going on.
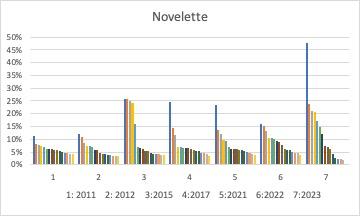
In novelette, the “interesting” year is 2015. In the top group of highly similar (but still falling off) nominees, we’re seeing the effects of the slate nomination that year. In subsequent years the pattern returns to “normal.” In general, the nomination slots in this category are sparsely filled in, even though overall ballot numbers are high. 2023 has the highest percentage filled at 38%, but the trailing off from the clear favorite shows no gaps. And we can see that it isn’t unusual for there to be a standout favorite for novelette.
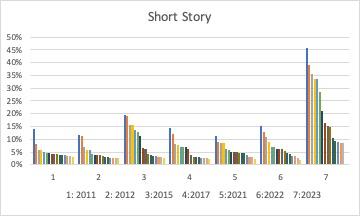
Short story is notoriously a category with a very long, low popularity tail. We see the same slating effect in 2015 that we saw for novelette, but once again it simply pumps up the higher end of the distribution rather than creating a discontinuity. The distribution for 2023 is “typical” but the overall percentage appearances are relatively very high compared to previous years, even at the low end of the tail. This is striking because it suggests that people are nominating from a relatively smaller pool of familiar works (and therefore more people are mentioning the same works). In most years, the short story long-list only accounts for 15-20% of the available slots (and here I suspect that we aren’t necessarily seeing incompletely filled ballots, but lots of nominations that are farther down the long tail). But in 2023 the long-list nominations accounted for 66% of the available nomination slots for the category. (This is a place where it would be very interesting to compare the total number of individual works that got mentioned.)

Dramatic (long) is in the “typical but interesting” group almost solely for demonstration that having a “runaway favorite” can be part of the typical distribution. It’s more common than not for more than half the nomination ballots in this category to include one particular title for that year. Otherwise, not much to say except that 2023 once again has a slight shift upward in popularity for the most popular titles, but a suppression of popularity for the bottom of the long-list. Once again, it leads in percentage of available slots filled by the long-list (58%) but not by a significant margin over previous years.
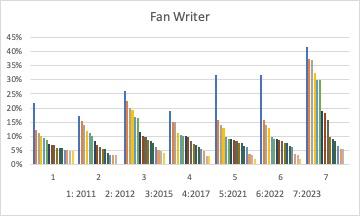
Fan Writer, much like several previous categories, has a similar “shape” of distribution in 2023 compared to earlier years, but the percentages are significantly elevated, resulting in the long-list accounting for 61% of available nomination slots (compared to a more typical 30% or so). In some years, Fan Writer has a clear favorite, but just as often no specific candidate stands out.
Extreme Cliff
Now let’s jump over to the most anomalous distributions – the ones with a “cliff” or “gap” in the distribution. When I posted my previous article, I had narrowed the analysis down to the fiction categories and the fan categories simply because it felt like they’d make a tidy comparison group. But as it turns out, all the “cliff” distributions are in these two groups.
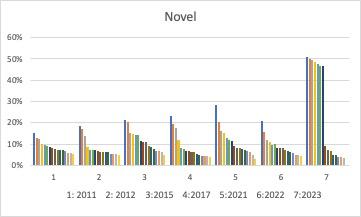
Compared to some other categories, novel usually has a rather flat and low distribution. My interpretation would be that this is an expected outcome of a large number of titles and a very wide range of tastes in nominators. It’s rare for there to be a clear favorite, and even the slates in 2015 only gave a slight bump to the top end of the group. All that makes 2023 highly unusual. Rather than the most commonly mentioned titles barely making 20% of the ballots, seven titles each showed up on 47-21% of nominating ballots in this category, with the next title down only appearing on 9%. In previous years, the novel long-list titles accounted for 26-37% of the available nominating slots, but in 2023 they accounted for 77%. If you subtracted 600 nominations from each of those seven titles, you’d get a typical-shaped distribution that is elevated above the historic percentages about the same as for other 2023 categories. Seven unusually high titles, and with one invalidated, that gives us the six finalists.
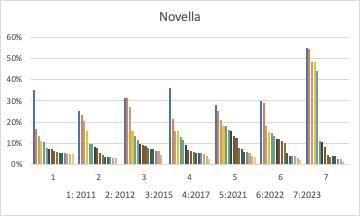
Novella has been fairly consistent in the past, with the most commonly mentioned titles appearing on more ballots than the most common novels. This makes sense, given that fewer novellas get published than novels, so we wouldn’t expect the distribution to be quite as flat and long-tailed. And it’s a little more common for the most frequently mentioned novellas to stand up a bit above the crowd. But in 2023, five titles break away from the (otherwise typical) crowd, leaving a distribution gap of around 450 nominations. The 2023 long-list titles don’t take up quite as much of the available space as for novel, only 61%, but far and away higher than any other year. As only five titles are in this abnormally elevated group, all of them are finalists.
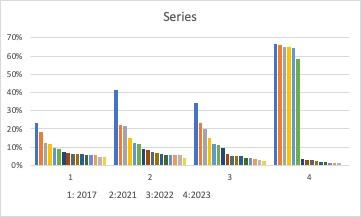
Series (for which I only have 4 years to compare) is the most extreme example of the cliff phenomenon. The three prior comparison years are all highly similar (differing only in the popularity of the top contender). But in 2023, we have six items each appearing on 58-66% of the ballots for this category. The gap between that group and the next item is around 750 nominations. And the 2023 long-list accounts for 81% of the available nomination slots. (For that matter, those top six items account for 77% of all available nomination slots in the category.) Coincidentally (?) “six” is the number of available places for finalists.
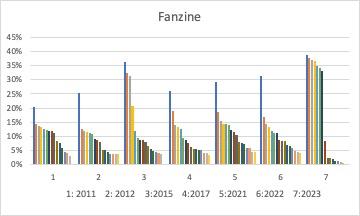
If you discount 2015 when slating more than doubled the expected numbers for a group of titles, and you discount 2023 (which we’ll get to), Fanzine nomination distribution is remarkably consistent, with a nice easy slope and usually one stand-out title at the top (though rarely the same title repeating). And then we get to 2023, where we have a whopping 7 items elevated above the crowd with a gap of about 150 nominations between them and the next candidate. Unlike the fiction categories, this group doesn’t quite dominate the available nomination slots, accounting for only 54%. But the “cliff” is still striking. And because none of the seven were invalidated for any reason, one of them didn’t get boosted onto the finalist list by that effect.
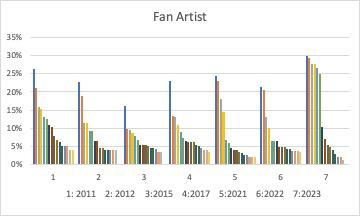
Fan artist is the last category that I identify as having a significant “cliff” in the distribution. As you can see, the nomination distribution is usually very consistent in percentages, the only unusual thing about this category being that it’s not uncommon for a couple of people to be stand-outs at the top. Although absolute nomination numbers tend to be low, the percentage of available slots taken on the ballots that do address this category tends to be a respectable 20-35%. In 2023, the 6 “elevated” candidates (all of whom end up finalists) push that percentage to 41% of the available slots, but due to the overall low numbers, the gap is only around 35 nominations. This is one of the curious aspects of this “cliff” phenomenon: the gaps aren’t consistent, either in absolute magnitude or in proportional relation to the number of nominating ballots in that category. The “cliffs” are clearly artifactual, but they don’t give a good clue to the nature of the underlying cause.
Non-typical, Other
This brings us to the final analysis group “not typical, but interesting for other reasons than having a distribution cliff.”
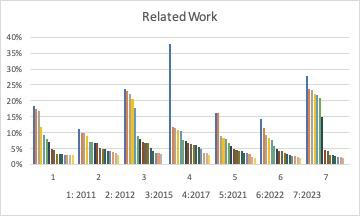
Related Work has Seen Some Things. In 2015, slating gave it the closes thing to a distribution cliff seen in previous years. I think part of this is that Related Work – being so diffuse in concept – has similar patterns to Novel in having a fairly vast field of candidates, is susceptible to stand-outs for whatever reason. We see this in 2017 when one particular work is massively popular relative to the rest of the field. But even so, 2023 has a discontinuous distribution, thought the high end of the field is a bit more sloped than in many of the “true cliff” distributions. The gap is only about 80 nominations, and overall the percentage of available slots taken isn’t vastly more than in other years.
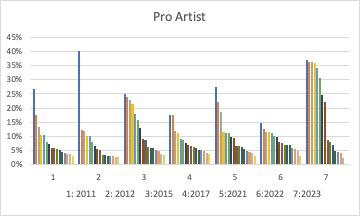
Professional Artist is somewhat similar to Related Work, in that there is a slight discontinuity in the distribution (with a gap of maybe 60 or so nominations) with 8 people in the upper group, but that group has a clear gradient, rather than being tightly clustered relative to the whole. The shape is reminiscent of the slate pattern in 2015, but more exaggerated.
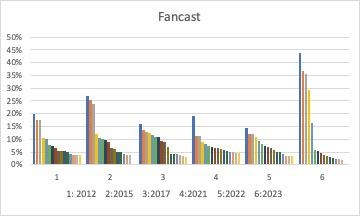
Fancast only started in 2012, so we’re missing one of my comparison years. At the beginning (including the 2015 slate effect) there’s a very subtle “cliff” pattern, but in more recent years (and presumably with a wider range of familiar and popular podcasts) the pattern has settled down into the much more typical “gradual tail.” So 2023 stands out as unusual, even though it has some similarities to the first two examples. To the extent that 2023 has something of a “cliff” it consists of a gap of around 40 nominations, with five items above the line, but as you can see, that upper group has a definite slope to it – so, not a true “cliff.”
Conclusions
Once again, I get to the end of this and don’t have any clear conclusions. Possibly I should stare at this data for a while longer, listen to what other people say about it, and then come back for some final thoughts. At this point, I’m no longer setting out to “prove” anything, but only to present the data in a form that might spark other people to come up with interpretative inspirations. A couple things that I wanted to jot down in the mean time:
- When there is a significant "cliff," the number of entries above the cliff is "around" the number of slots on the final ballot. Plus/minus. I counted seven categories that I classified as having a "cliff", with 5 (x1), 6 (x2), or 7 (x4) items above the cliff. Of those, there was only one category where, after invalidations, not all the "clifftop" entries were able to fit on the final ballot. However both in terms of the magnitude of the cliff and the type of category, there was no thematic consistency.
- Another interesting thing that happened in the voting phase is that, in six categories, the first place winner was obvious in one or two rounds (and if it took two, the item only needed a few votes to go over the finish line). Those six categories were all either in my "typical but interesting" group or my "non-typical for reasons other than a standard cliff" group. I have no idea whether this is meaningful. It's just an observation.
Note that I’m posting this late on a Tuesday evening and Wednesday is my “work on site” day. So I won’t have much opportunity to participate in discussions or moderate pending comments until tomorrow evening.
Major category: